Nashwaak Watershed Association
Watershed Monitoring
Latest Water Quality Results
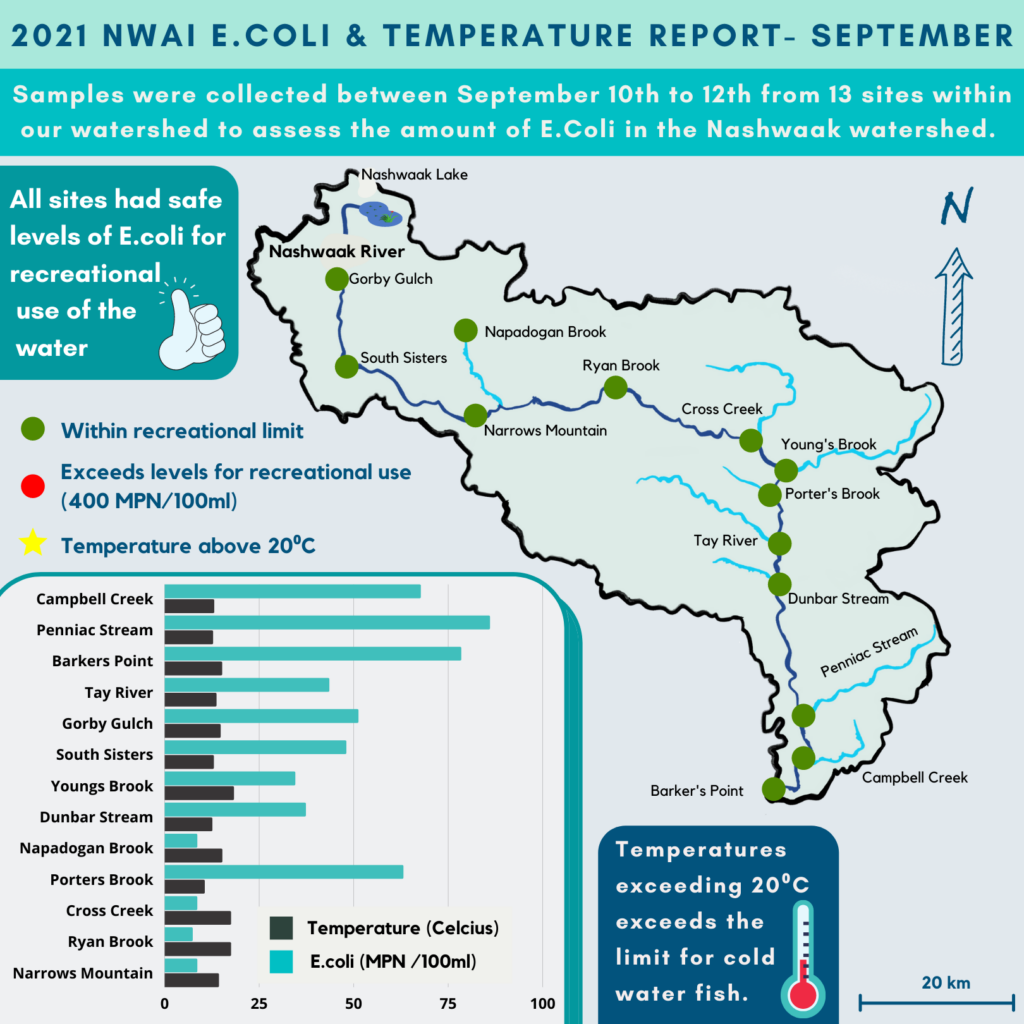
E. Coli is measured as MPN/100 ml. The guideline for recreational waters is 400 MPN/100 ml for a single sample. Samples exceeding the guideline are highlighted in red on the map. There were no exceedances detected during the September water quality survey.
Water Quality
Maintaining the quality of the surface water is extremely important for ensuring a healthy watershed. Clean water is one of New Brunswick’s most important resources. We rely on it for drinking, growing food, manufacturing goods, producing electricity, and for recreational activities. The flora and fauna of the Nashwaak watershed also rely on clean water.
Water quality in the watershed is currently being affected by several direct and indirect influences including: chemical, toxic, and deoxygenating wastes from industry, forest spraying, agricultural and urban runoff, etc.
Find out more about the water quality and temperature, including historical results, of the Nashwaak Watershed on our Watershed Health Story Map: here
Nashwaak Watershed’s Water Quality Data
Water Temperature
Warmer water contains less oxygen than colder water so as river temperatures rise and dissolved oxygen decreases, fish begin to experience stress, particularly salmonids (salmon, charr, and trout species). To escape warm waters in the mid-summer, many fish species will move to smaller, cooler tributaries or pools near cold seeps to survive. High temperatures can delay migration; exhaust energy reserves, which can result in reproductive failure; reduce egg survival; slow growth of fry and smolts; and decrease resistance to disease. 20°C is considered the threshold minimum temperature for assessing physiological stress in Atlantic salmon.
Spring-fed streams are ecologically important as, being fed by groundwater, they are less susceptible to variations in air temperature and can buffer changes in climate. They support animals that don’t occur in the main stem and maintain the base flow of the river. Monitoring the temperature of our ecologically important tributaries using pendant loggers will help us to better understand the sources of thermal inputs so that we can protect, manage, and restore them in the future.
2021 Temperature Logger Summary
| Temperature Metric | Data |
|---|---|
| Highest Peak Temperature | 30.9ºC in the Nashwaak Upstream of MacPherson Brook |
| Lowest Peak Temperature | 13.4ºC in Nixon Brook |
| Average Hottest Day | August 20th |
| Summer Average (Main Stem) | 19.0ºC +/- 3.5ºC |
| Summer Average (Tributaries | 15.2ºC +/- 2.2ºC |
| Coolest Site | Nixon Broke, 8ºC +/- 1.2ºC |
| Warmest Site | Nashwaak at outlet of Nashwaak Lake, 21.0ºC +/- 2.9 ºC |
| Avg. # of Days Minimum above 20ºC | 25 in the mainstream; 1 in the tributaries |
| Avg. # of Days Maximum above 23ºC | 27 in the mainstream; 1 in the tributaries |
Reports
Our recent and historical reports can be found on our Reports page.
Water quality infographics can be found in the education resources section.
Full water quality or temperature results in .xls or .csv format are available from NWAI upon request.